Highways
The Highways page allows users to observe changes in speed, volume, and VMT along a selected length of a highway.
Learning objectives
By the end of the tutorial, users will be able to:
- select a segment of highway determined by milepost
- understand and navigate options for plotting speed, volume, and VMT
Step 1: Select a highway
Use the drop down menu at the top of the page select the highway of interest.
Step 2: Select a segment of the highway by using milepost
Use the Start Milepost and End Milepost to select the segment of highway of interest. The Start Milepost is the south or west end and the End Milepost is the north or east end of the highway. By default, and reset, the updated plots will show the full length of the freeway.
Step 3: Select date and time range parameters
Select the date range of interest by using the Start and End Date options. The Start and End Time options allows comparisons of specific times across the selected date range (e.g. evening rush hours).
Step 4: Select figure plotting options
Data are visualized either aggregated or standard. By default, data are visualized aggregated for all days of the week across all highway lanes (lane 1 refers to the left most lane). Plotted features can be turned on and off by clicking on legend parameters.
The following parameters were selected for the examples of grouped and ungrouped plots:
- Highway: I-84 EB
- Start Milepost: 0.45
- End Milepost: 4.95
- Start Date: 2018-02-01
- End Date: 2018-02-14
- Start Time: 15:00
- End Time: 19:00
Grouped/Aggregated
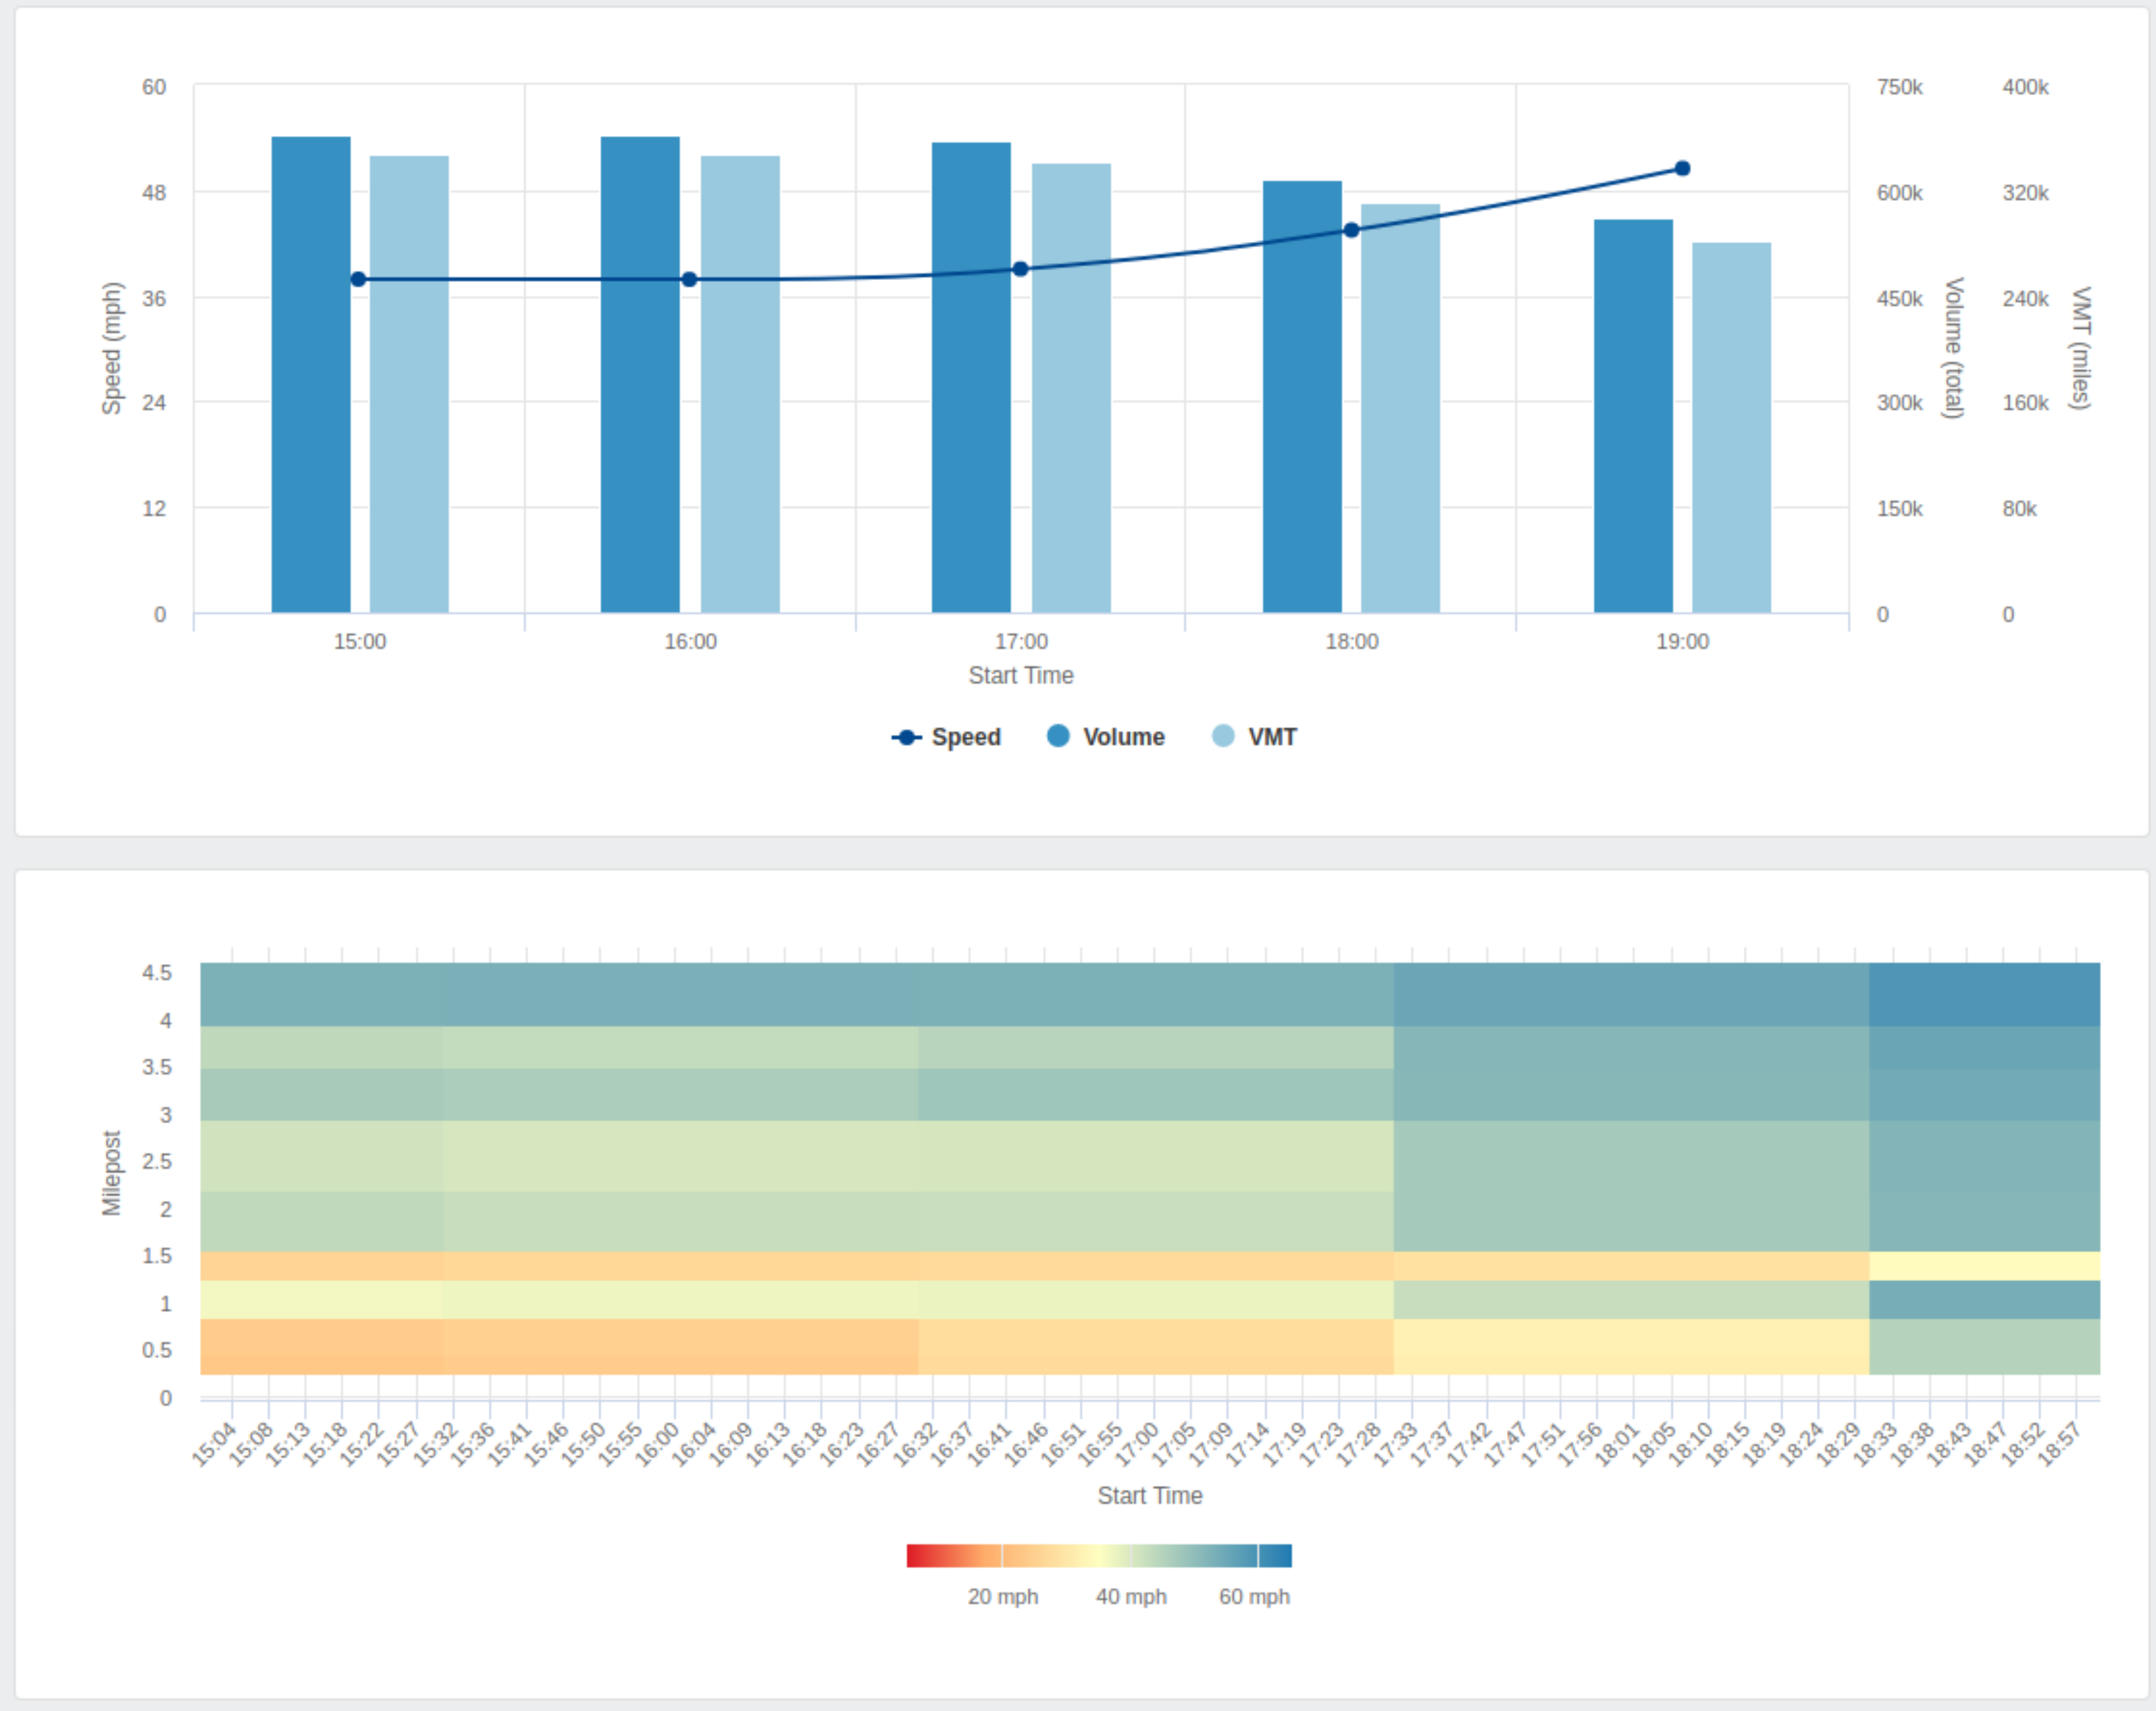
The top panel of Figure 1 shows a general trend of decreasing volume and VMT, and increasing speed from 15:00 through 19:00. The bottom panel of Figure 1 is a chloropleth with time on the x-axis and milepost on the y-axis. At 15:00 the speed of traffic is worse at the beginning of I-84 EB, traveling up the y-axis at 15:00 traffic becomes more clear further east. The lower chloropleth panel shows the bulk of congestion occurs within the first few miles of I-84 EB until around 18:00.
Ungrouped/Standard
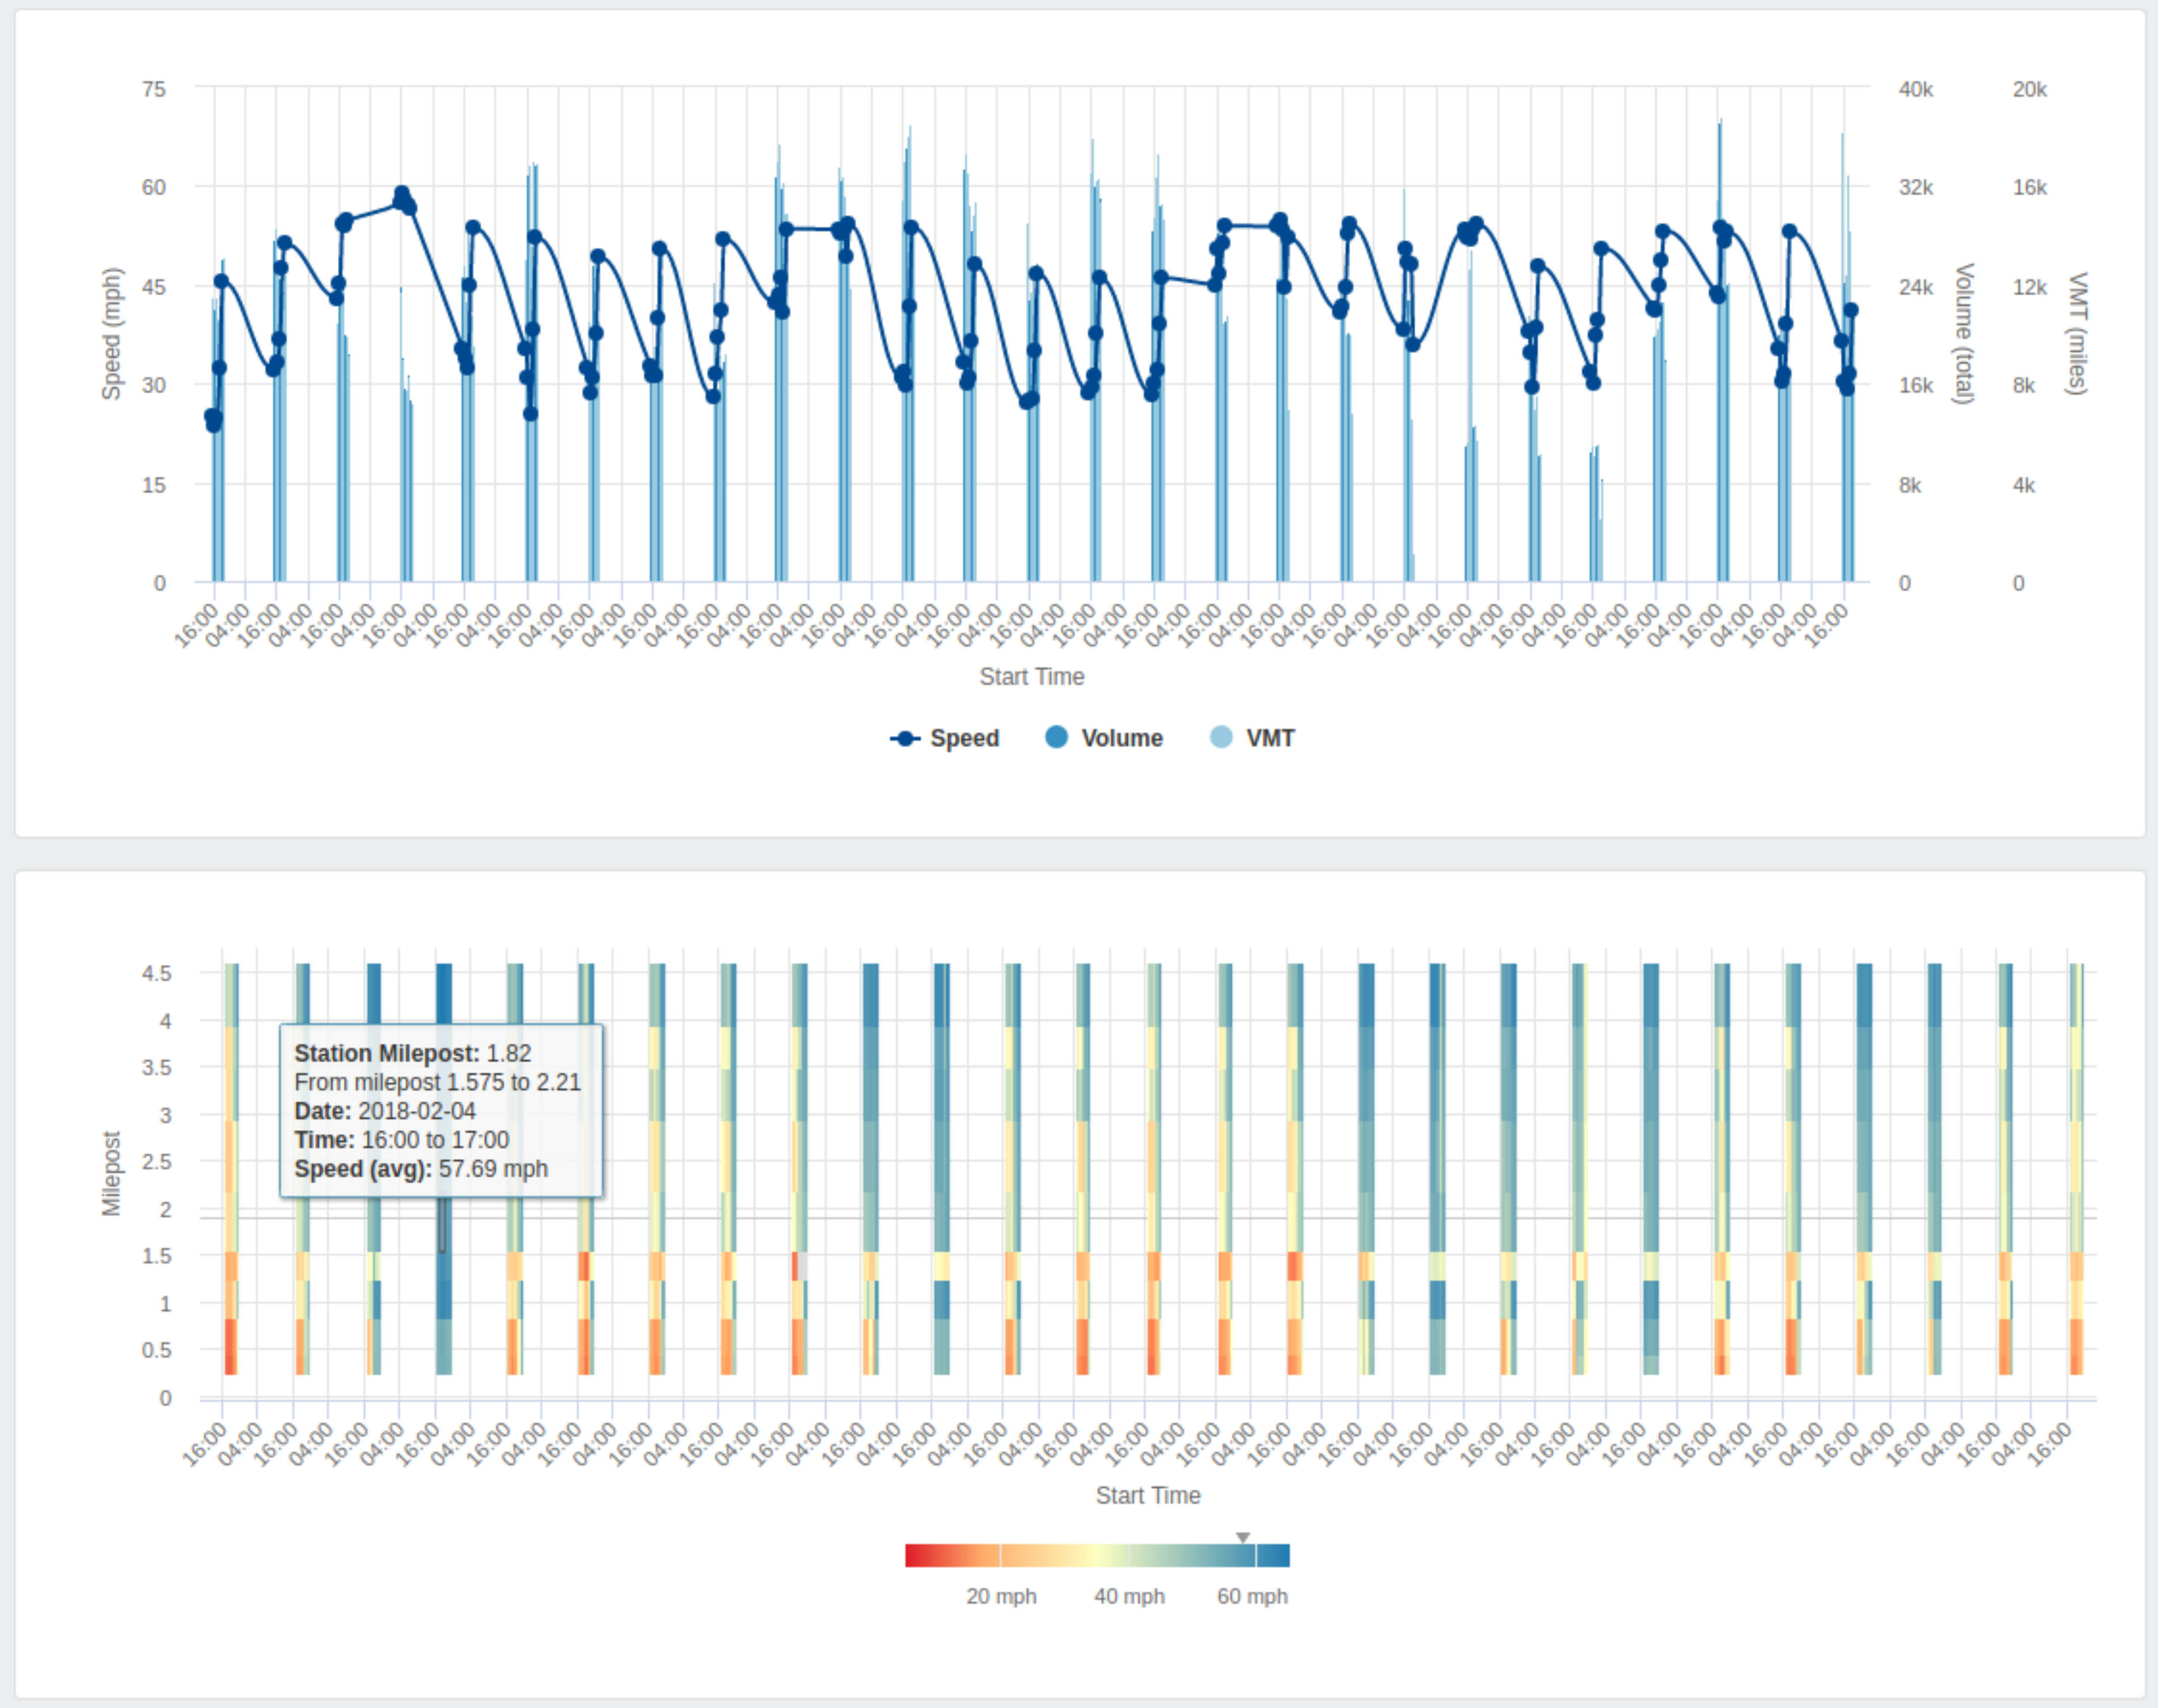
Figure 2 shows data as a continuous time series for only the start and end times selected (15:00 through 19:00). Details of each point or chloropleth cell are pop up as you scroll over a data point of interest. Of all the days selected in February, 2018-02-04, is the only date to to show speeds averaging above 50 mph throughout the selected I-84 EB corridor between 15:00 and 19:00. Go Eagles!
Last updated: 2025-02-19