Vehicle Length (Freight)
The primary purpose of collecting vehicle length data is to analyze freight versus non-freight traffic where vehicle lengths less than 20 ft are non-freight traffic. PORTAL uses "freight" to distinguish these two traffic types.
Data Availability Note: There were periodic outages of the freight data feed in Fall 2017. In particular, there was an extended outage from 2017-09-30 through 2017-10-27.
Learning objectives
By the end of the tutorial users should be able to:
- select a station and set plotting parameters
- explore and understand what percent of traffic is freight versus non-freight, the change over time of of freight versus non-freight traffic, and vehicle counts by speed ranges over time
- download data used in rendering plots
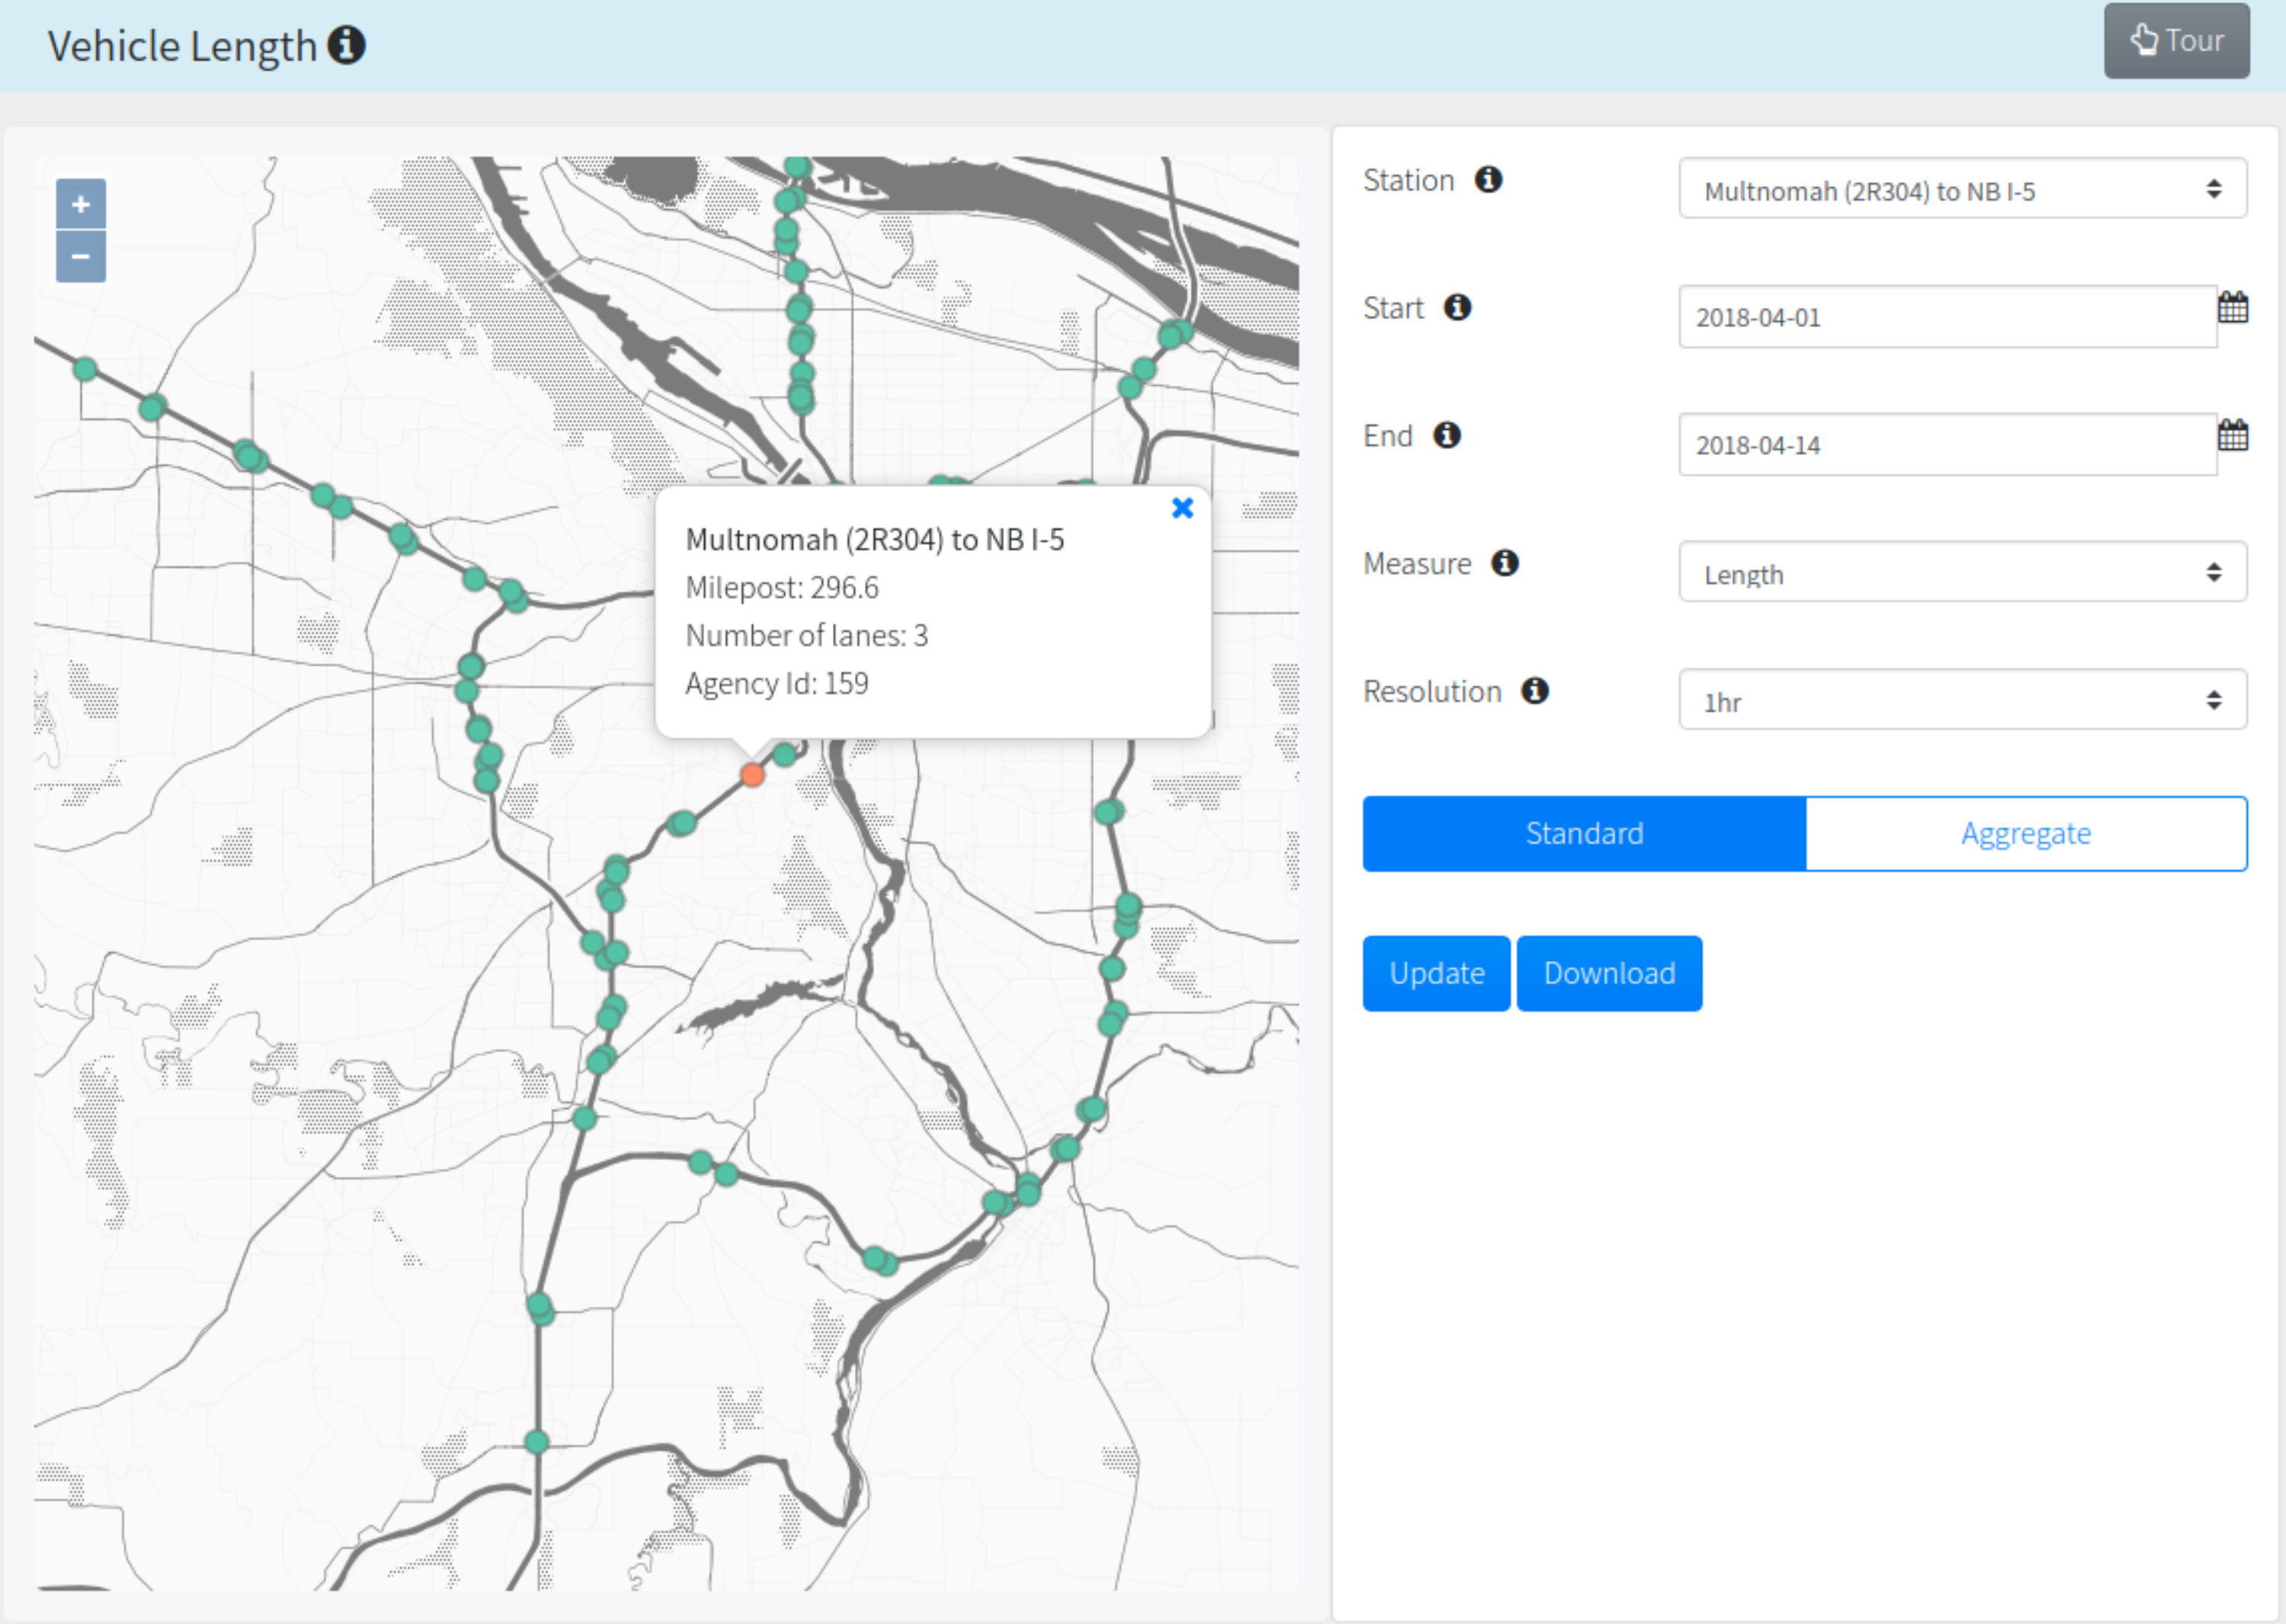
Step 1: Select a station
Users can select a station by either choosing a station from the "Station" drop down menu or by clicking on a station on the map represented by the green dots. Vehicle length data is currently only available from ODOT.
Step 2: Select a start and end date
Select a start and end date of interest by either entering the date under "Start" and "End", or by using the calendar menu.
Step 3: Select a metric of interest
Select the metric of interest by using the drop down menu under "Measure". The two metric options for plotting are either vehicle length or speed.
Step 4: Select a resolution
Select the time resolution of interest by using the drop down menu under "Resolution". The options are 15 minutes, one hour, and one day.
Example
Step 5: Select type of plot
Once a type of plot is selected (description on the types below) then click on the "Update" button to render the plot. Once the plot is rendered, users have the option to zoom in by clicking and dragging the cursor the length of the desired time frame. It is recommended to use the "Standard" plot option, for daily vehicle length count.
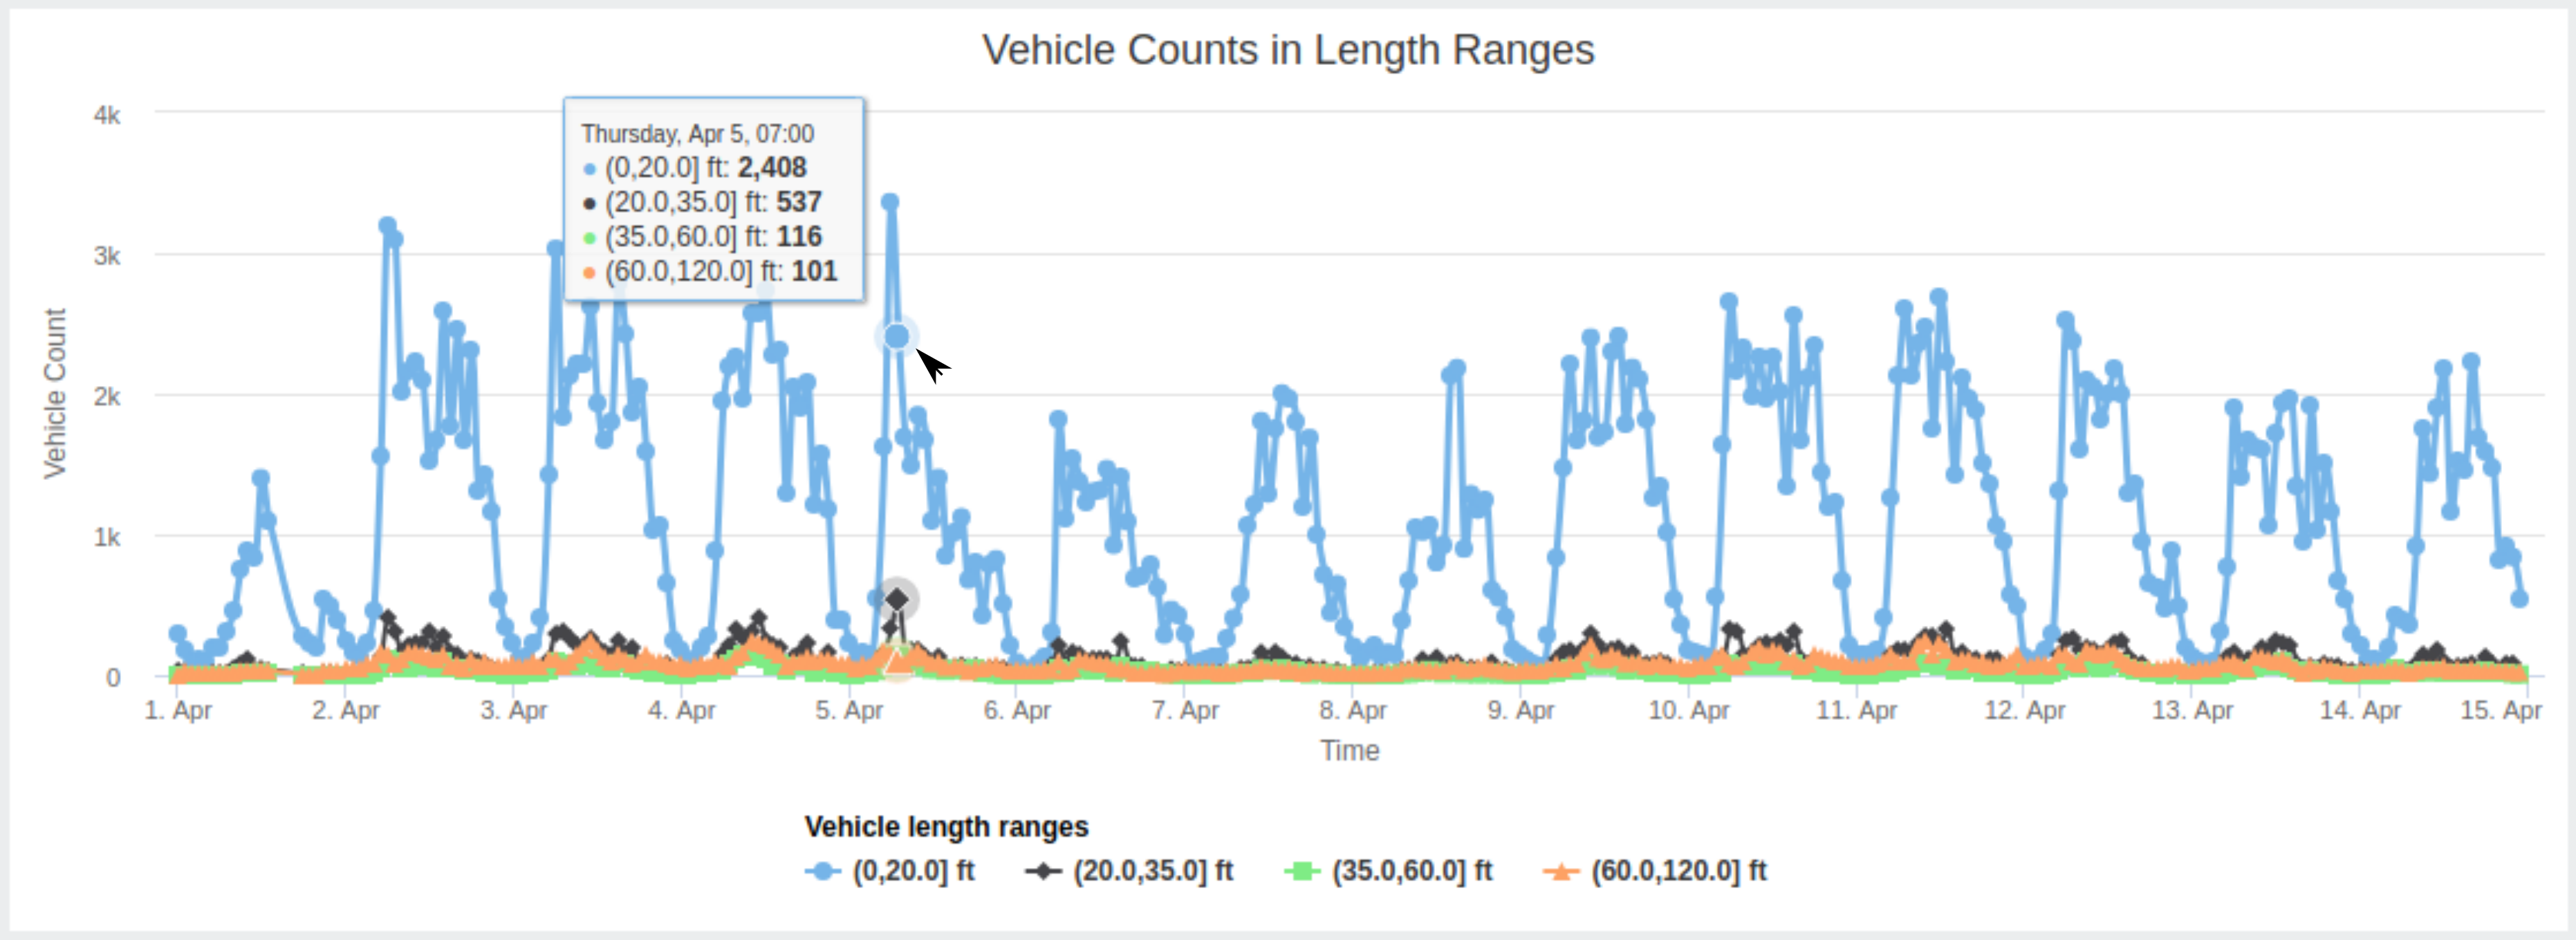
Vehicle length
The "Standard" plot option will show daily vehicle length count based on four distinct binned lengths (0, 20] ft, (20, 30] ft, (35, 60] ft, and (60, 120] ft. The plotted vehicle length ranges can be turned on and off by clicking on the individual legend keys. Individual point values will appear in a pop-up window by moving the cursor to the desired point.
Example
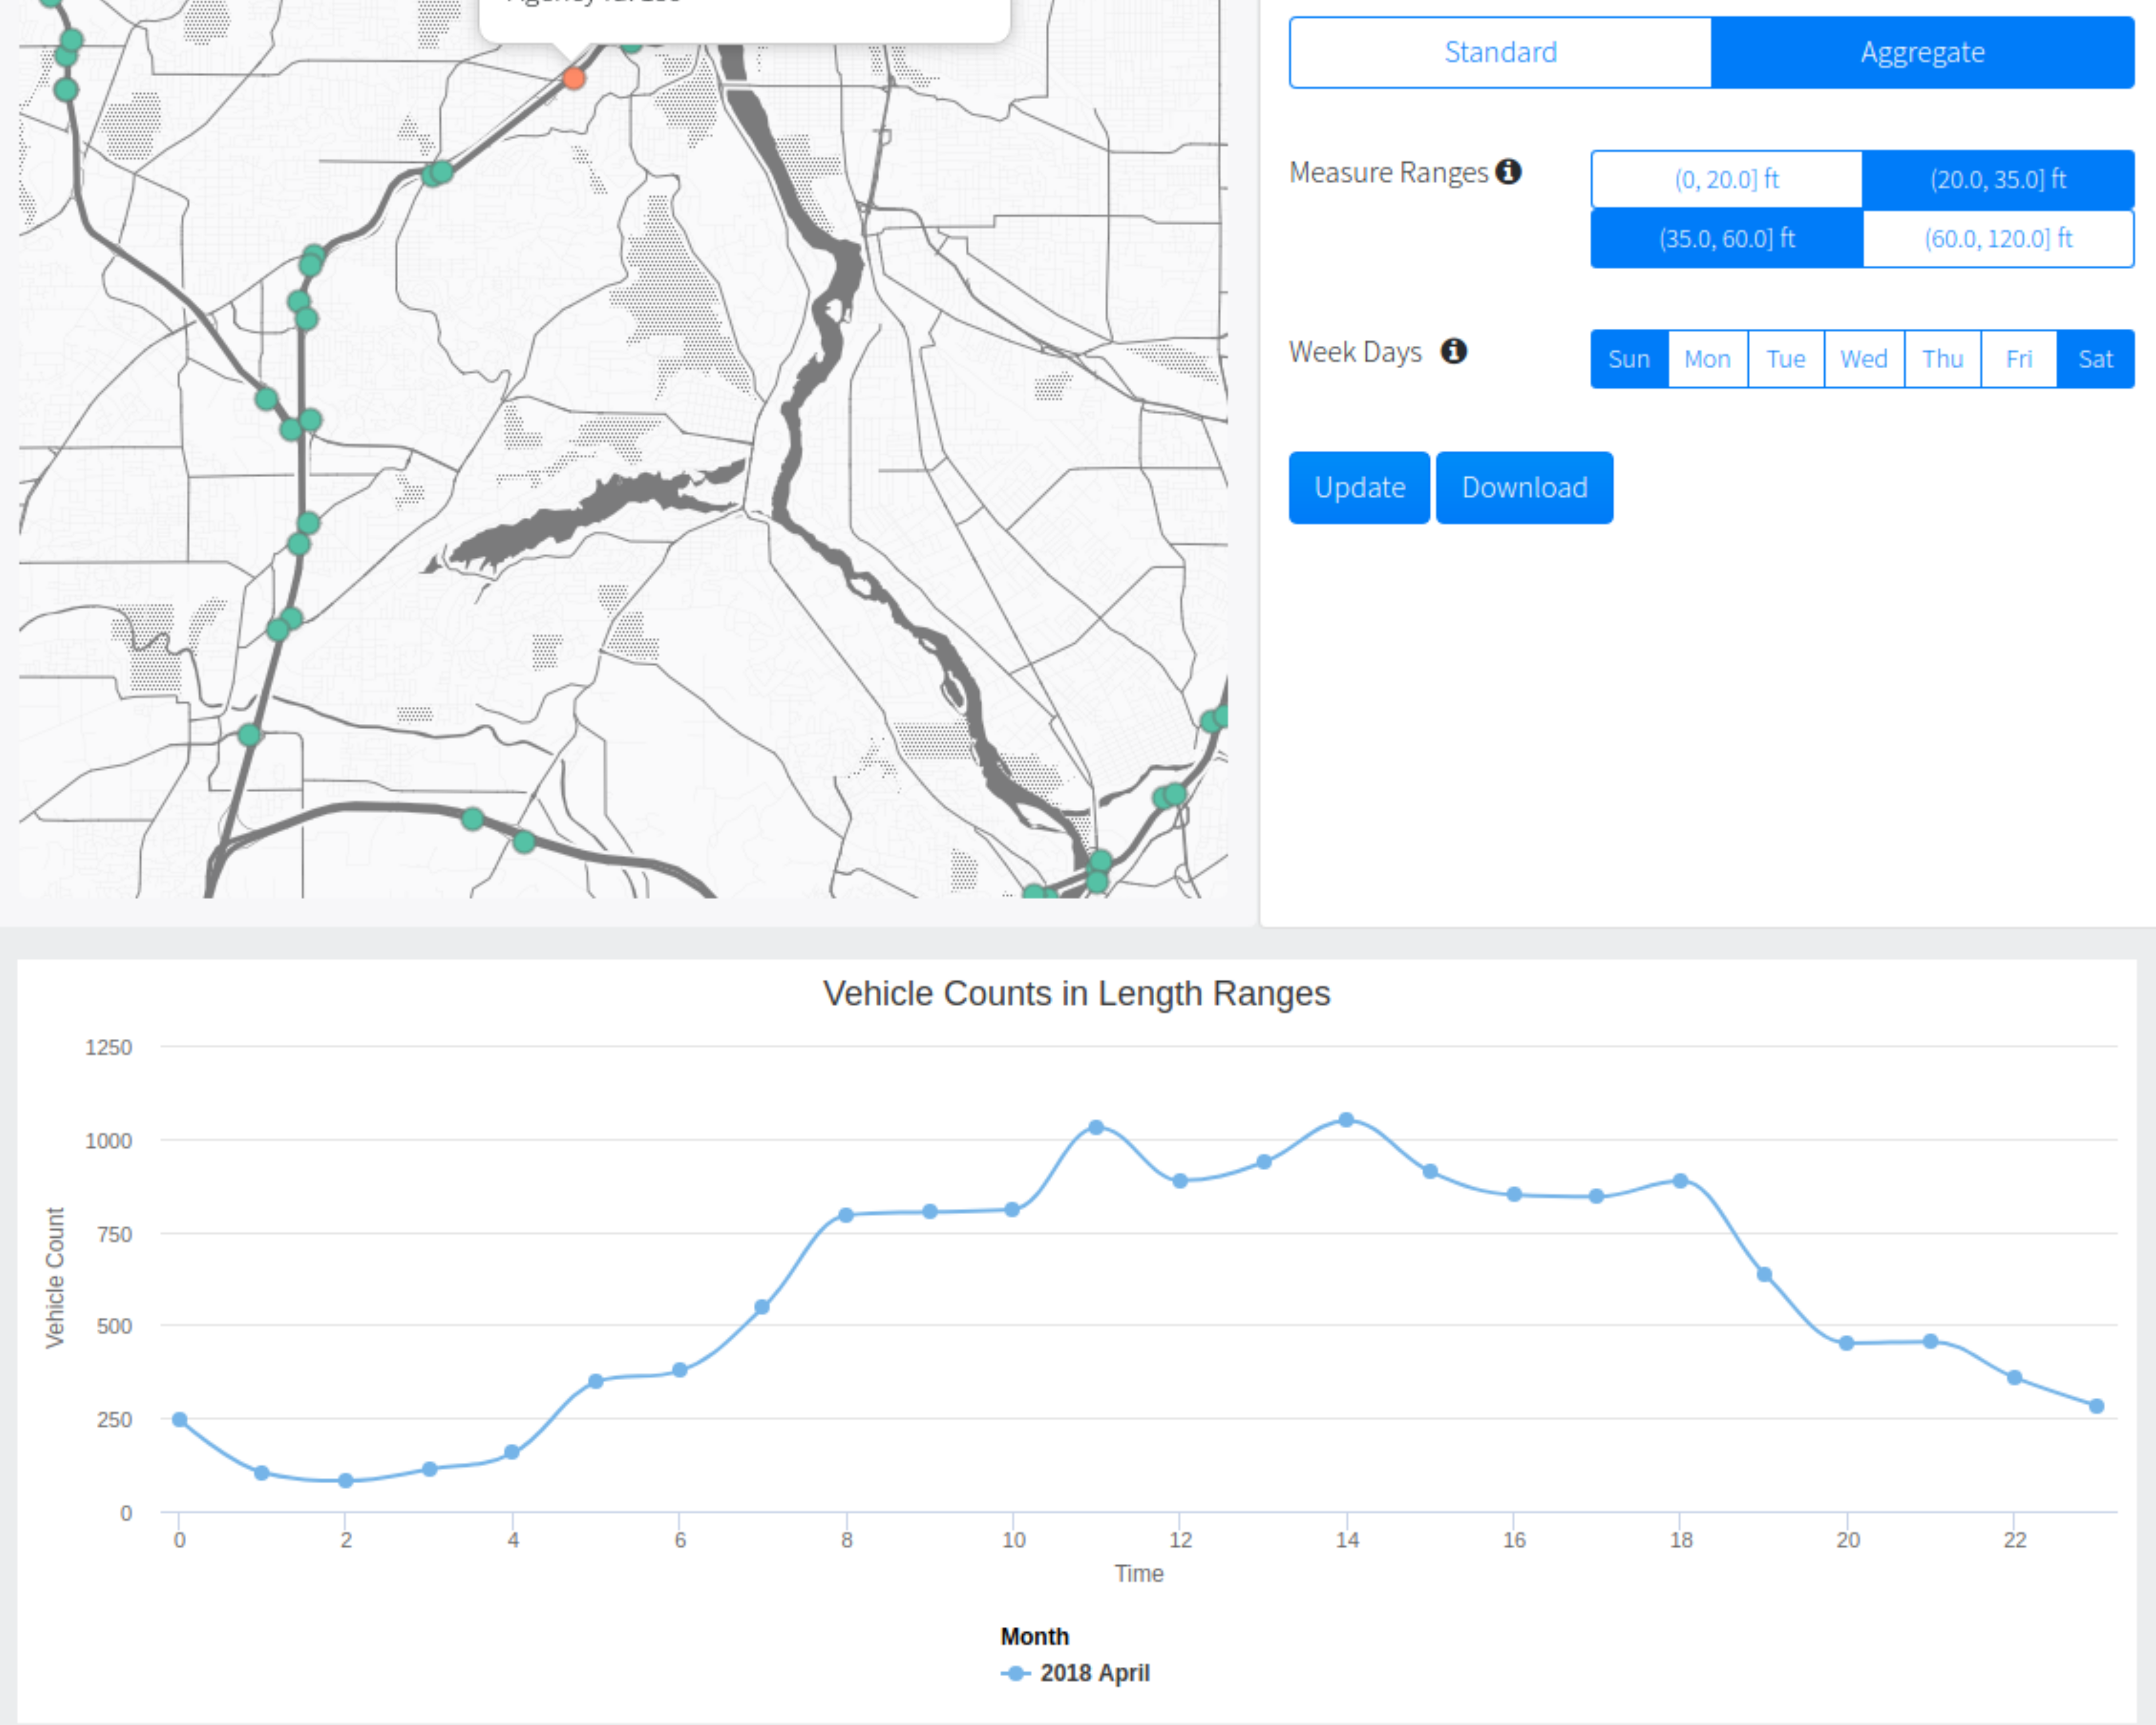
The "Aggregate" plot option will prompt two additional selection criteria, "Measure Ranges", and "Week Days". "Measure Ranges" provides the option of aggregating the selected ranges. "Week Days" provides the option of selecting which days of the week should be aggregated. The start and end date will default to the month and year of the initial start and end date. The resulting plot will show the total vehicle count of the selected aggregated options over a 24-hour period for an entire month. The default selection is all days of the week and all vehicle length ranges.
Example
Step 6: Download data
Click on the "Download" button to download data used to generate each type of plot.
Vehicle length The "Standard" data download will export one file with a date and time stamp and the corresponding vehicle count for each vehicle length range (five columns). The "Aggregate" data download will export the aggregated data used to generate the plot; a column with the 24-hour time stamp and a column of total vehicle counts (two columns).
Vehicle speed The "Standard" data download will export one file with a date and time stamp and the corresponding vehicle count for each vehicle speed range (11 columns). The "Aggregate" data download will export the aggregated data used to generate the plot; a column with the 24-hour time stamp and a column of total vehicle counts (two columns).
Additional Resources
- User manual
- Presentations:
- Monsere, Chris. Adding Continuous Truck Counts to the Regional Data Archive (PORTAL). 2010 May 12.
- Monsere, Chris. Adding Continuous Truck Counts to the Regional Data Archive (PORTAL). 2010 July 14.
- Monsere, Chris. Permanent Freight Data Collection Infrastructure and Archive System. 2013 April 10.
- State of the Practice Review
- TCU Manual
- Map: Freight Volumes and Freeway Detectors (March 2012)
- MnDOT. Loop- and Length-Based Vehicle Classification, Federal Highway Administration - Pooled Fund Program TPF-5(192). 2012 November.
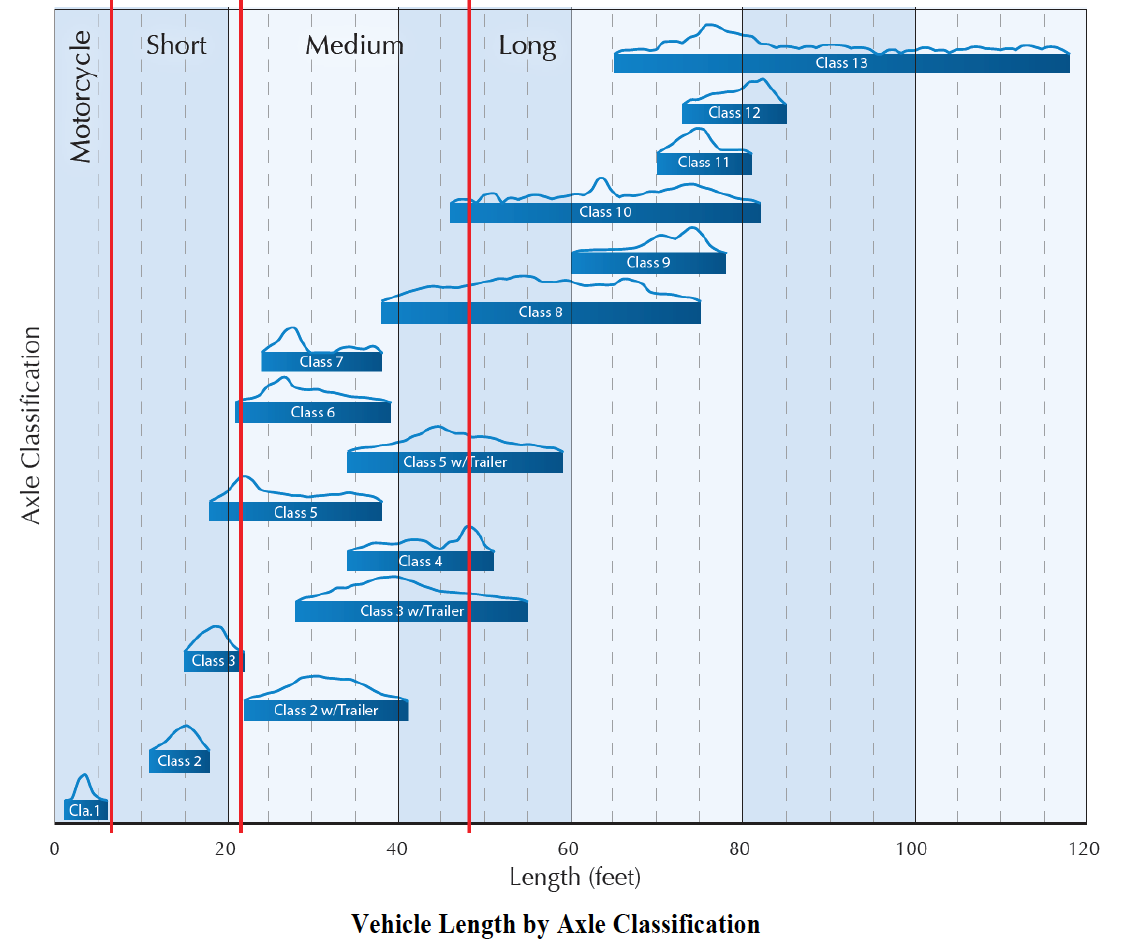
The figure below, from the pool-fund study (MnDOT, 2012), provides an illustration of the association between vehicle length and vehicle class. The table below lists the class names and is taken from a MAG study (2012), which also provides descriptions of the vehicle classes. The vertical red lines in Figure 7 show one potential set of length bins and how those length bins capture different vehicle classes. For example, the "short" bin in this figure will capture all Class 2 vehicles (passenger cars), most Class 3 vehicles (other two-axle, four-tire single unit vechicles), some Class 5 vehicles (two-axle, six-tire single-unit trucks), and a very few Class 6 vehicles (three-axle single-unit trucks).
Table 1: Class names and descriptions from MAG Internal Truck Travel Survey and Truck Model Development Study.
| Class | Description |
|---|---|
| Class 1 | Motorcycle |
| Class 2 | Passenger cars |
| Class 3 | Other two-axle, four-tire single unit vehicles |
| Class 4 | Buses |
| Class 5 | Two-axle, six-tire, single-unit trucks |
| Class 6 | Three-axle single-unit trucks |
| Class 7 | Four or more axle single-unit trucks |
| Class 8 | Four or fewer axle single-trailer trucks |
| Class 9 | Five-axle single-trailer trucks |
| Class 10 | Six or more axle single-trailer trucks |
| Class 11 | Five or fewer axle multi-trailer trucks |
| Class 12 | Six-axle multi-trailer trucks |
| Class 13 | Seven or more axle multi-trailer trucks |
Last updated: 2020-07-07