Stations
The Stations section allows users to get travel time, vehicle miles traveled, speed, and volume for a specific station. There are three different pages associated with this section.
Learning objectives
By the end of the tutorial, users will be able to:
- select a station
- understand, navigate, and use the Explore options on the Two Quantity Chart page
Step 1: Select a station
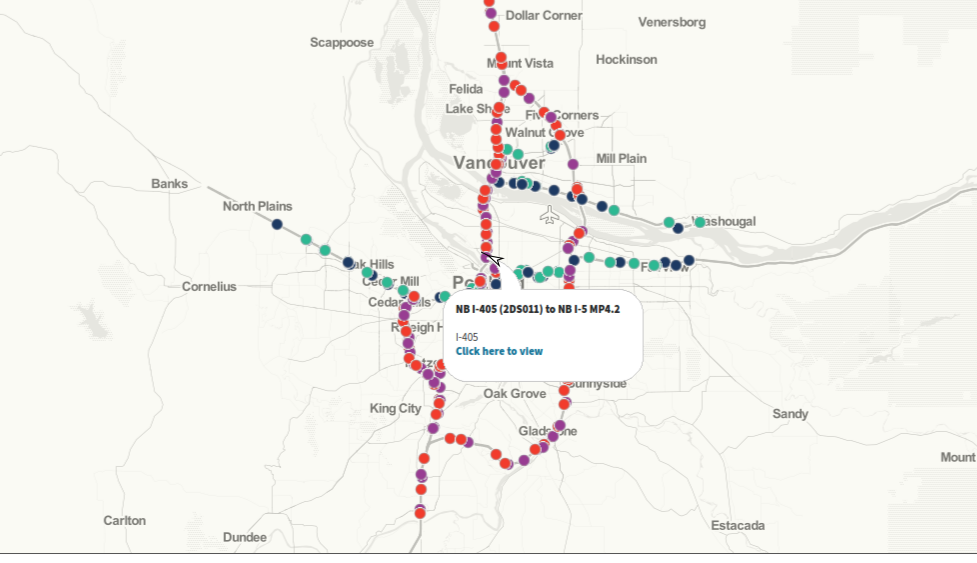
Select any single station on the map. The stations are grouped by the direction of traffic (north, south, east, west). Once a station has been selected a pop-up will provide the name of the station and location, and a link to view more information (Figure 1).
Step 2: Current station information
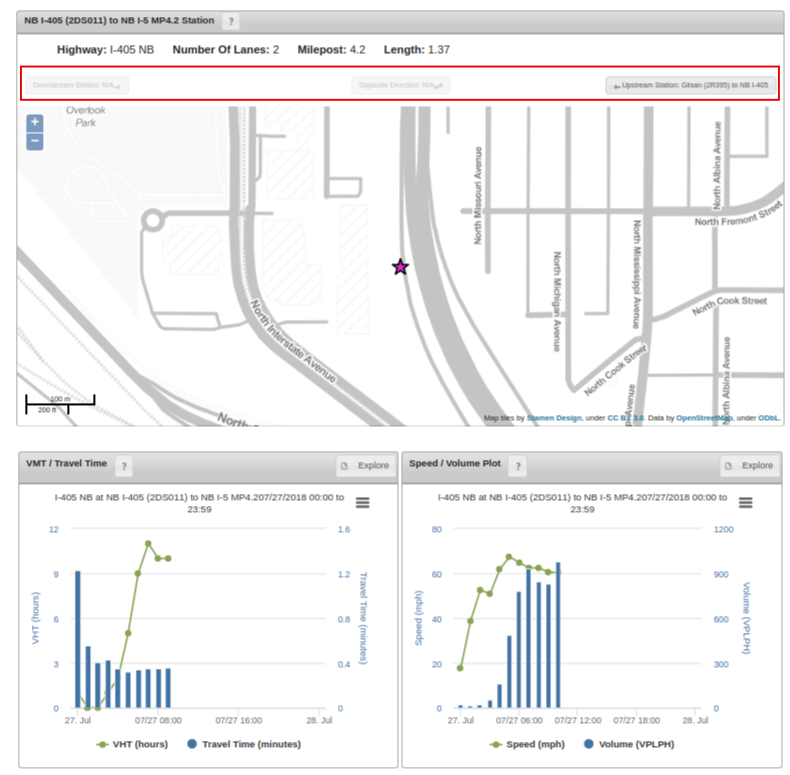
Clicking on the Click here to view more link will open to a summary of current station information page. Figure 2 shows a screen shot of the summary stations page. The top panel shows a more detailed map and the location of the station designated by a star. Additional information provided on this page include highway name, number of lanes, milepost of the station location, and the length of the station data it represents. If available, the option to click on the downstream station, the station for the opposite direction, or the upstream station will be highlighted available. If these options are unavailable, the buttons will be grayed out (Figure 2, outlined in red box).
The bottom left panels show the vehicle hours traveled (VHT) and travel time. The bottom right panel shows the speed and volume per lane per hour (VPLPH). Data presented in these two panels shows the current daily information. For historical and additional information click on the Explore buttons located at the upper left corner of either of the plots; this will continue to the final Stations page to visualize two different quantities and download data.
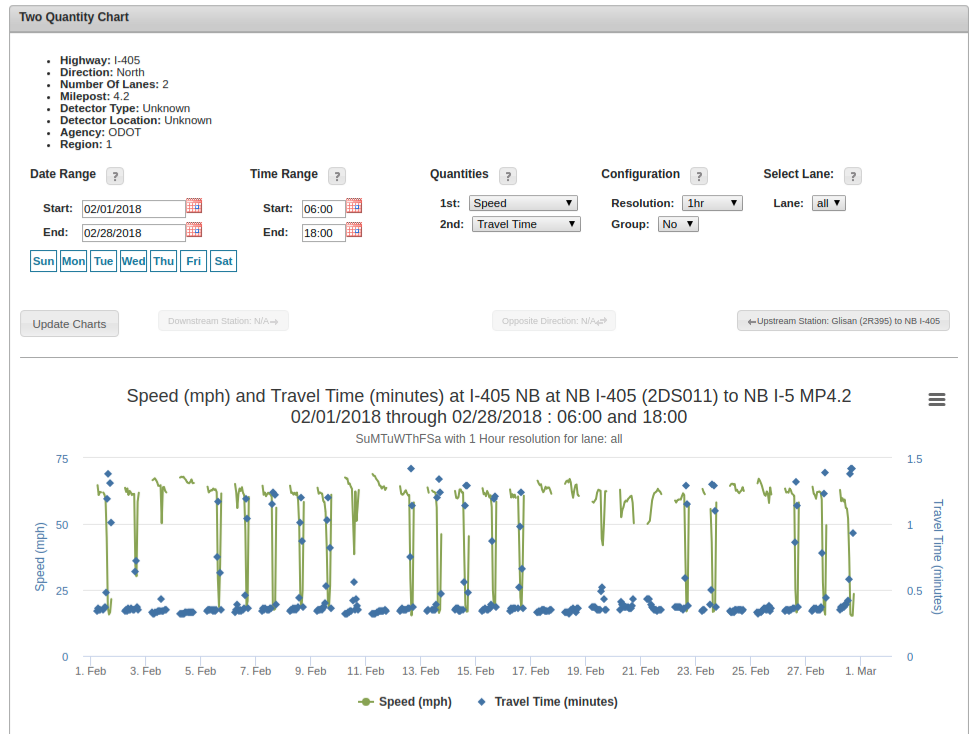
Step 3: Two quantity chart
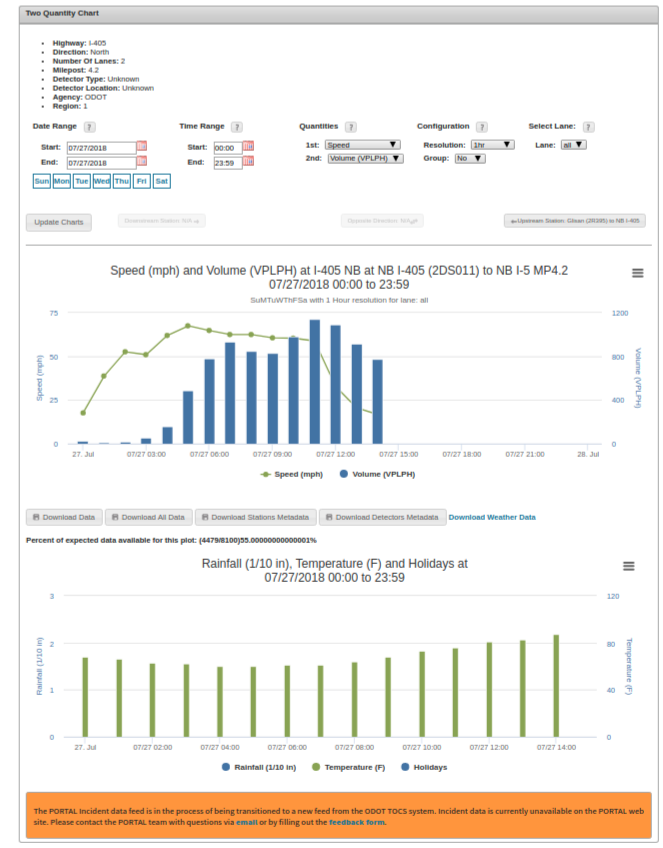
The Two Quantity Chart page provides more detailed information about the station, options for plotting two different quantities, concomitant weather data, and the option to download data. Click on the legend description to turn plotted parameters on or off.
Data and visualization parameters
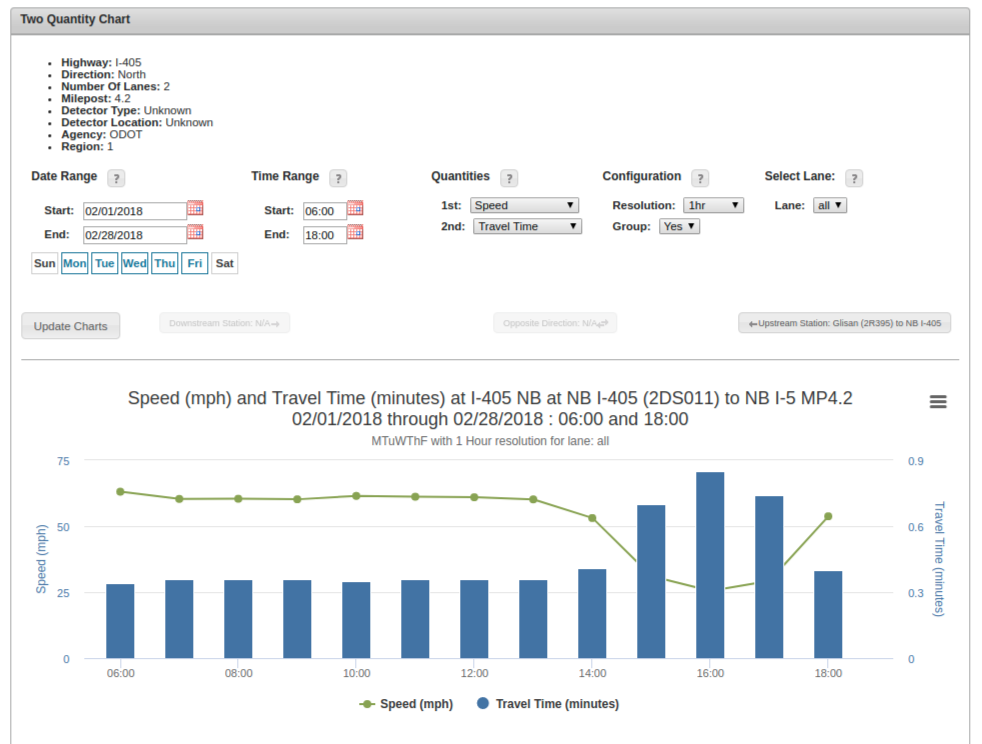
Date Range
In addition to the Start and End date options, days of the week can also be selected by clicking on each button. The default selection is all days of the week and today's date for the Start and End date.
Time Range
To select a specific time range of interest use the Start and End inputs (e.g. peak PM traffic or peak AM traffic). The default selection is set to all day.
Quantities
The default quantities plotted are speed and VPLPH; other quantities are average volume (can only be used with Group parameter set to Yes), occupancy, vehicle miles traveled (VMT), VHT, travel time, and delay.
Note: Loop detectors have been known to give lower speeds at night. If a WSDOT detector type is identified as "Wavetronix", the detector will default to the speed limit at that station location when volume = 0.
Configuration
Select the temporal resolution of interest (20 sec, 5 min, 15 min, 1 hour, 1 day, 1 month, 1 year). Data are originally recorded at 20 second intervals. If the Group parameter is set to Yes then data are aggregated based on day of week selection under Date Range. If the Group parameter is set to No then data are visualized as continuous along the x-axis according to the date and time selected.
Lanes
The lane number starts from the left and goes to the right (e.g. the far left lane is lane 1).The options for plotting data is either by one lane at a time or aggregated across all existing lanes. The option for plotting data by lanes is currently unavailable. However, individual lane data can be downloaded by clicking on the Download All Data button at the bottom of the plot.
Example
Example
Step 4: Download data
There are five types of data available to download: Each row of data for the Download Data and Download All Data options is determined by the temporal resolution selected.
Download Data is the data that is shown on the selected plot. (e.g. If plotted data are aggregated hourly for speed and VPLPH, then the data downloaded by this option is the aggregated data for those two quantities).
Download All Data is the unaggregated data used to generate the selected plot. Individual lane data can be found in this dataset.
Download Stations Metadata is metadata for all stations available in PORTAL. Attributes for stations metatdata are station_id, agencyid, highwayid, highwayname, milepost, description, upstreamstation, downstreamstation, oppositestation, longitude, and latitude. More information about stations metadata can be found here.
Download Detectors Metadata is metadata for all detectors available in PORTAL. Attributes for detectors metadata are detectorid, stationid, stationname, lanenumber, highwayid, highwayname, and milepost. More information about detectors metadata attributes can be found here.
Download Weather Data Weather data is from the Portland International Airport weather station. Attributes include temperature (F), windspeed (mph), visibilitymiles, precipitation (1/10 inch), name (null), and displayvalue (null).
Last updated: 2019-11-07