Stations
The Stations section allows users to get average volume, total volume, speed, occupancy, travel time, vehicle miles traveled for single or multiple stations; and volumes for ramp data.
Learning objectives
By the end of the tutorial, users will be able to:
- set thresholds to assess station health defined by data availability
- select a mainline and ramp stations using either the map or metadata table
- understand, navigate, and use the filters for visualizing data for two quantities
- understand, navigate, and use the filters for comparing single quantity historical data
Step 1: Select a mainline or ramp station
To select a station, use either the map or the metadata table.
Using the map
The map legend shows how to distinguish between ODOT and WSDOT maintained mainline and ramp stations (Fig. 1).
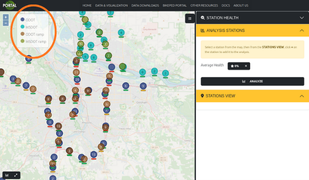
As you zoom into the map the icons will begin to disaggregate from approximate locations closer to actual locations of detection of either in-ground loops or radar detectors. (If you notice that the location is incorrect please let us know.) The numbers within each icon indicates the number of stations within that area. Once you find the station(s) of interest, click on the icon. Each time an icon is clicked, the selected icon will change color and a list of stations will show up on the right sidebar menu under "Stations View" (Fig. 2).
Use the "+" icon under the station name listed under "Stations View" to add it to the "Analysis Stations" list. Stations listed under "Analysis Stations" are selected stations for further data exploration and analysis. To remove a station from the list of "Analysis Stations", click the "-" icon under the station name.
For additional information about a specific station, toggle the "i" icon to display and hide the station metadata.
Using the metadata table
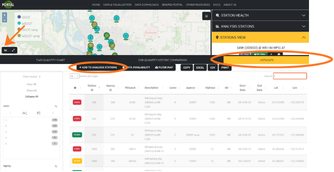
If you know the name(s) of the station(s) of interest, you can select the stations by using the metadata table. Click the graph icon located at the bottom left corner of the map and then select the "Metadata" tab (Fig. 3). Within this window, you can use the filters on the left side to narrow down your search or you can use the search bar to find a specific station. Once you find the station(s) you're looking for, select one station at a time by clicking on the row and then clicking the "+ Add to Analysis Stations" button located at the top of the window. Selected stations for data exploration and analysis will then be listed under "Analysis Stations"
Step 2: Set mainline and ramp station data availability thresholds and date range
Select any single station on the map. The stations are grouped by the direction of traffic (north, south, east, west). Once a station has been selected a pop-up will provide the name of the station and location, and a link to view more information (Figure 1).